


UK city house price growth slowed in August following weaker demand post-Brexit, new figures show. According to the latest Hometrack UK Cities Index, annual house price growth has fallen to from 9.5% to 8.2% as the slowdown seen in cities across the south of England in recent months intensified in August. The 20 city Index recorded […]
 UK city house price growth slowed in August following weaker demand post-Brexit, new figures show.
According to the latest Hometrack UK Cities Index, annual house price growth has fallen to from 9.5% to 8.2% as the slowdown seen in cities across the south of England in recent months intensified in August.
The 20 city Index recorded its lowest level of quarterly growth for six months as a seasonal lull in market activity combined with weaker demand post-Brexit and the April stamp duty change reduced the rate of house price growth.
Cambridge has registered the fastest deceleration in growth from an annual rate of 16% in March to just 6% as affordability pressures and weaker investor demand impact growth.
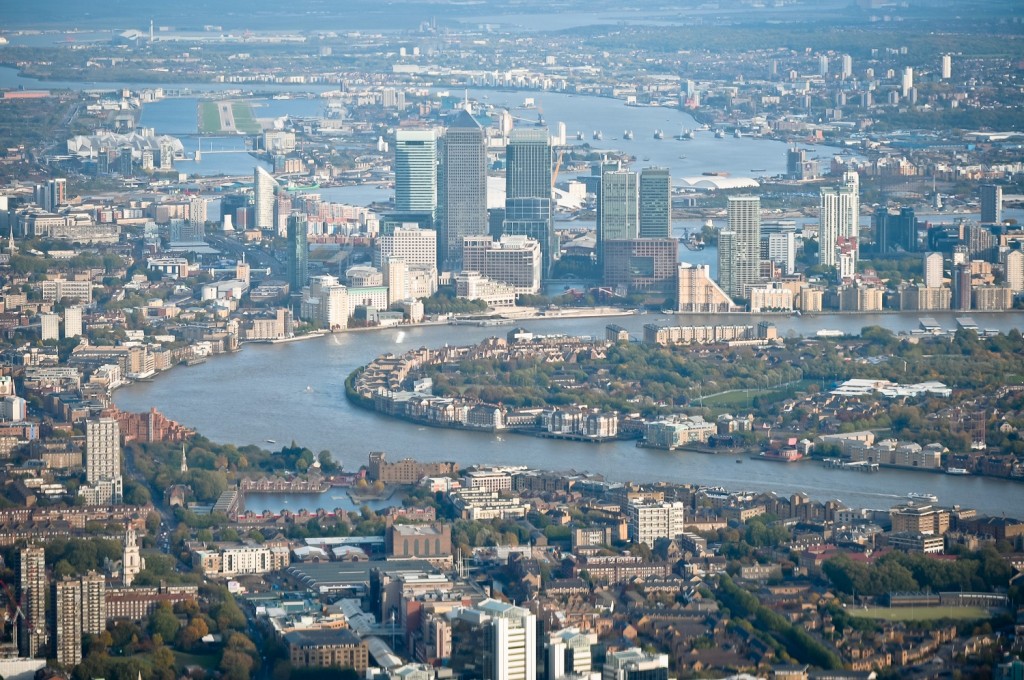
Bristol continues to register the fastest rate of annual growth (13.1%) followed by London (10.4%), but growth in both cities is slowing.
A similar trend is evident in most cities located in southern England including Oxford and Bournemouth, where annual growth has also eased in the last few months.
Conversely, regional cities such as Glasgow, Liverpool, Birmingham and Edinburgh have all posted above average growth in the last three months as low mortgage rates and affordable property prices support growth.
Richard Donnell, insight director at Hometrac, said: “Despite the overall slowdown in London, it is dangerous to view the capital as a single housing market. While many of the central boroughs have seen low rates of growth, in parts of outer London where house prices are 30% lower than the London average, such as Barking and Dagenham and Havering, prices are rising by more than 15%, although these areas are starting to slow.
“Regional cities such as Glasgow, Liverpool, Birmingham and Edinburgh have all posted above average growth in the last three months as low mortgage rates and affordable property prices support growth. Aberdeen has registered a small bounce back in house prices – after house prices registered a £20,000 fall since July 2015 – the rebound in growth reflects the fact that the recent fall in the oil price has now been priced into capital values.”
Annual city house price increase
| City | Average price | Annual house price increase | % last quarter to August 2016 |
| Liverpool | £114,300 | 7.2% | 4.1% |
| Glasgow | £113,900 | 4.5% | 2.7% |
| Aberdeen | £184,800 | -6.7% | 2.3% |
| Edinburgh | £203,800 | 3.3% | 2.2% |
| Birmingham | £144,400 | 8.0% | 2.1% |
| Manchester | £147,500 | 7.4% | 1.9% |
| Nottingham | £137,900 | 7.5% | 1.8% |
| Newcastle | £127,700 | 4.1% | 1.7% |
| Bristol | £256,100 | 13.1% | 1.7% |
| Portsmouth | £217,400 | 9.0% | 1.5% |
| Sheffield | £128,700 | 3.4% | 1.3% |
| Southampton | £214,200 | 7.7% | 1.2% |
| Belfast | £123,100 | 3.1% | 1.2% |
| London | £475,700 | 10.4% | 0.9% |
| Oxford | £409,800 | 8.1% | 0.9% |
| Leicester | £151,400 | 5.6% | 0.7% |
| Bournemouth | £263,500 | 6.2% | 0.4% |
| Cardiff | £188,100 | 6.3% | 0.3% |
| Cambridge | £407,200 | 6.0% | -0.4% |
| Leeds | £148,800 | 4.8% | -0.8% |
| 20 city index | £239,400 | 8.2% | 1.9% |
| UK | £202,400 | 7.4% | 1.6% |


