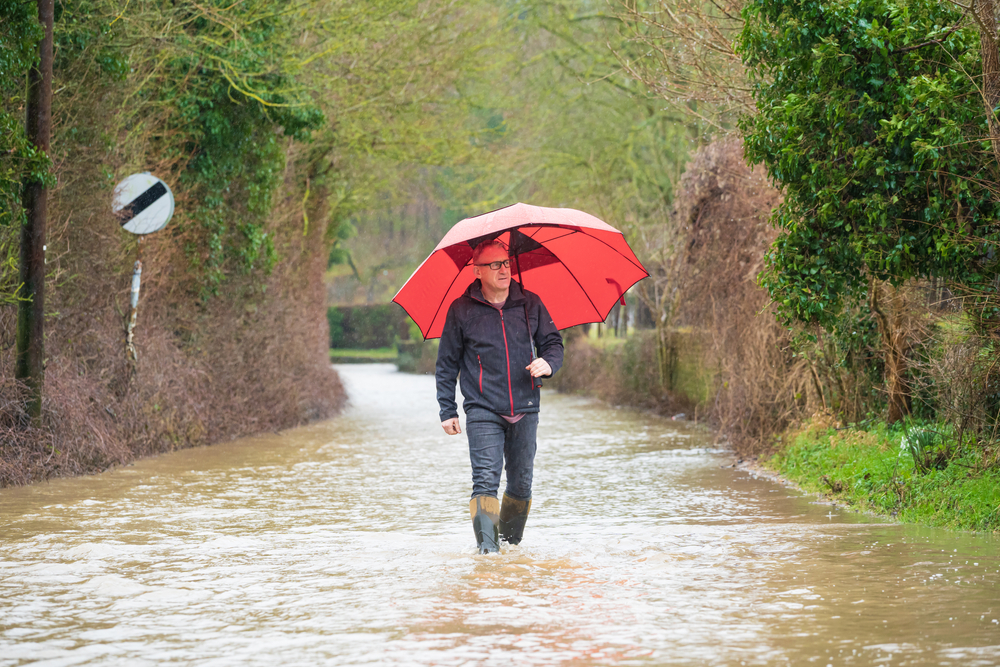
 A study by estate agent comparison site, GetAgent.co.uk, analysed house price data for the last 10 years in areas earmarked by the Environment Agency as being most at risk in England of flooding.
Indeed, over the last decade there have been a number of serious flooding events across the country.
GetAgent’s analsysis showed, while house prices in England had increased by some 49%, in the areas marked as ‘at risk’ of flooding, growth had trailed marginally behind at 47%.
“However, house price growth in the wider counties in which these flood risk locations were found had only increased at 45% during the same time frame.
“This suggested flood risk areas were outperforming the more local market.
Colby Short, founder and CEO of GetAgent.co.uk, said: “On a case by case basis, flooding is costing homeowners thousands upon thousands and those worst at risk year in year out will no doubt struggle to sell at a decent price as a result.
“However, looking across the nation at the top line, the risk of flooding is yet to dampen house price growth across the majority of these most at risk areas and in fact, house prices in a lot of flood risk areas are climbing at a faster pace than the wider areas they are situated within.
This is no doubt due to a shortage of stock which in some cases leaves us no choice but to build and live in areas that could be a flood risk.
“When you also consider that many of our major towns and cities are naturally home to more buoyant house prices but are located on or near major waterways, then it makes sense that prices will remain high regardless of the dangers.”
Average house prices in flood risk areas (Source: GetAgent.co.uk)
| Flood Risk | Average house price in flood risk areas (2019) | 10 year price growth | Average house price in wider county (2019) | 10 year price growth |
| > 10,000 | £268,131 | 46% | £202,256 | 39% |
| 7,500 – 10,000 | £194,171 | 38% | £236,319 | 42% |
| 5,000 – 7,500 | £230,086 | 44% | £251,860 | 42% |
| 2,500 – 5,000 | £283,320 | 49% | £279,450 | 47% |
| All | 264566 | 47% | 265262 | 45% |
| England | N/A | N/A | £247,400 | 49% |
Worst affected areas
While all flood risk areas on the list had seen prices increase over the last 10 years, there were some which had trailed behind the wider area when it comes to this level of growth.
North Lincolnshire was the worst affected, with local house prices slumping down 16% behind growth seen across Lincolnshire as a whole. East Hertfordshire house prices have trailed growth across Hertfordshire as a whole reducing by 9% in the last decade.
Chichester (-9%), Southampton (-8%), Arun (-8%), Maidstone (-8%), Folkestone and Hythe (-7%), Newark and Sherwood (-7%), Richmond upon Thames (-7%) and Boston (-6%) also experienced some of the lowest rates of local house price growth when compared to the wider area in the last 10 years.


