


House prices have soared since the pandemic began with the average property in the UK now setting buyers back £268,000 according to the Office for National Statistics (ONS).
 The type of home you can get for this kind of money, of course, depends on which part of the country you are looking.
So what kind of property can you get in some of the most populated areas for this kind of money and, more importantly, which locations offer you the best bang for your buck?
One business decided to dig deeper into the numbers and analyse the current properties on the market to find out.
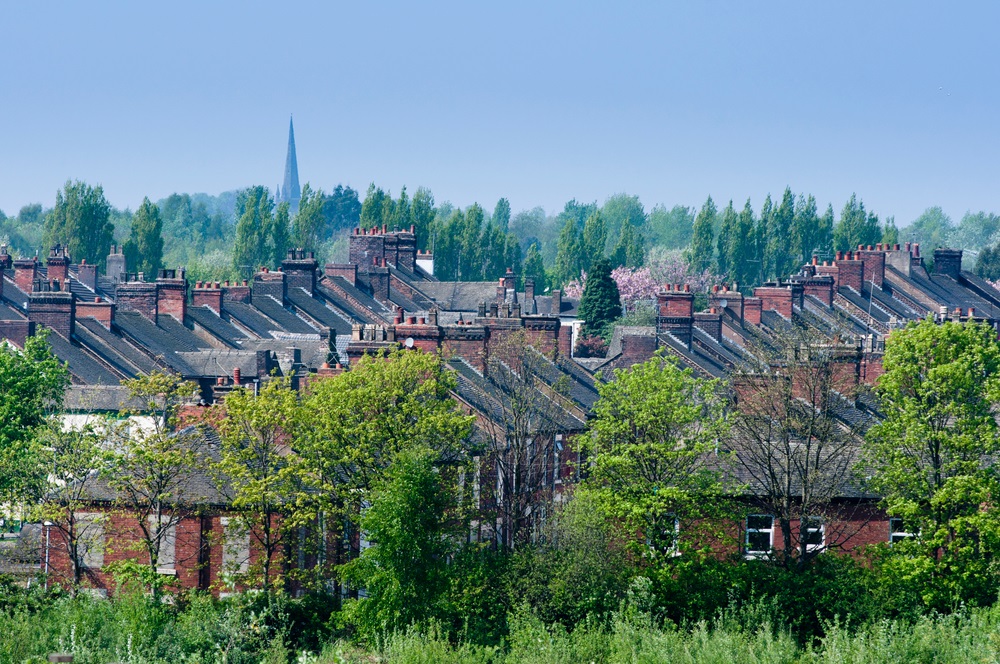
The study by ConservatoryLand discovered, Stoke-on-Trent, Derby and Kingston upon Hull were the places in the UK which offered the best value for money for buyers.
It based its research on the number of bedrooms, bathrooms, square meterage, chances of a driveway and the type of house. It looked for these features in homes for sale, at the average price, in the top 30 most populated cities.
And while Stoke-on-Trent came out top as the best city for value for money, with the average property being detached and offering buyers three bathrooms, four bedrooms and a driveway, the capital came out at the bottom.
Indeed, in London, the same price will give you two bedrooms, two bathrooms and zero chance of a driveway. What’s more, Stoke’s home will offer 86 square metres of space whilst the London equivalent will provide just 47 square metres.
The top 10 cities for value for money (source: ConservatoryLand)
| Rank | City | Average No. of bedrooms | Average No. of bathrooms | Chance of driveway (%) | Average square metre |
| 1 | Stoke-on-Trent | 4 | 3 | 80% | 86 |
| 2 | Derby | 4 | 2 | 100% | 91 |
| 3 | Kingston upon Hull | 4 | 2 | 100% | 87 |
| 4 | Blackpool | 3 | 2 | 80% | 90 |
| 5 | Wolverhampton | 4 | 1 | 100% | 90 |
| 6 | Newport (Wales) | 4 | 2 | 60% | 95 |
| 7 | Birmingham | 3 | 1 | 100% | 90 |
| 8 | Liverpool | 3 | 2 | 80% | 92 |
| 9 | Coventry | 3 | 2 | 80% | 89 |
| 10 | Preston | 4 | 1 | 80% | 91 |
The top 10 worst cities for value for money (source: ConservatoryLand)
| Rank | City | Average No. of bedrooms | Average No. of bathrooms | Chance of driveway (%) | Average square metre |
| 1 | London | 2 | 2 | 0% | 47 |
| 2 | Reading | 2 | 1 | 0% | 88 |
| 3 | Southend-on-Sea | 2 | 1 | 0% | 94 |
| 4 | Bristol | 2 | 2 | 20% | 92 |
| 5 | Manchester | 2 | 1 | 40% | 86 |
| 6 | Luton | 3 | 1 | 40% | 89 |
| 7 | Sheffield | 3 | 1 | 40% | 88 |
| 8 | Milton Keynes | 2 | 2 | 40% | 91 |
| 9 | Cardiff | 3 | 1 | 40% | 100 |
| 10 | Norwich | 2 | 2 | 80% | 83 |


