


With the first kick-off of the new Premier League season just a few weeks away, online estate agent eMoov.co.uk, is looking at how property values near top team football stadiums have changed in a year. Football returns with the Charity Shield, as FA Cup winners Arsenal take on champions Chelsea on August 8. The two London […]
With the first kick-off of the new Premier League season just a few weeks away, online estate agent eMoov.co.uk, is looking at how property values near top team football stadiums have changed in a year.
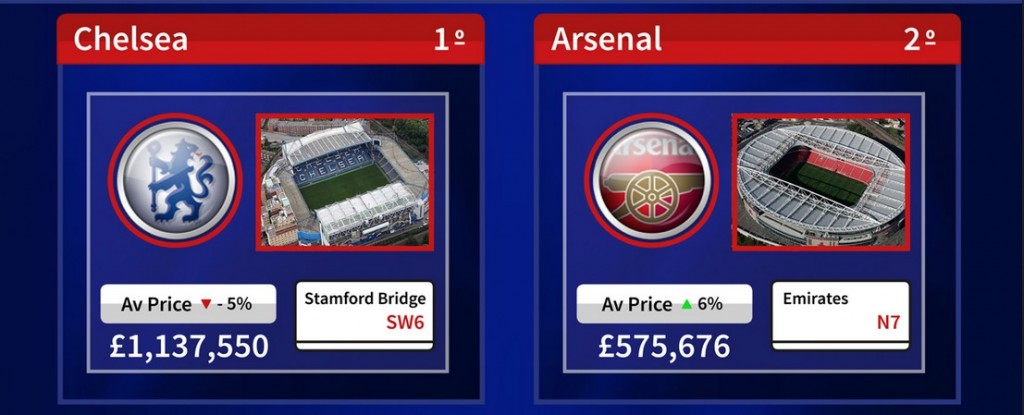
Football returns with the Charity Shield, as FA Cup winners Arsenal take on champions Chelsea on August 8. The two London giants are also top of the property league, with the most expensive average house prices in the top flight. Chelsea top the table with the average in the SW6 post code at £1,137,550, but a slip in form has seen prices fall by 5 per cent since the start of last season. Property around the Emirates on the other hand has climbed 6 per cent, although Arsenal are still some £600,000 behind the league leaders.
Unlike the first team who have struggled for years without success, Tottenham have managed a top four finish. Property around White Hart Lane has also climbed by 6 per cent to an average of £312,410, keeping them within arm’s reach of bitter rivals Arsenal.
Tottenham is due to undergo extensive redevelopment and with its nearest tube stop, Seven Sisters, earmarked to be part of Cross Rail 2, Spurs could soon climb the league as a potential property hotspot.
London teams dominate the top six, with West Ham clinching the last Champions League spot with an average price of £306,451. However with a move to the Olympic Stadium on the horizon, the Hammers could soon leapfrog Spurs, having already enjoyed the highest rise in house prices (7 per cent) in the league since last year.
Man United manage 10th place in the league above rivals City by a notable six places and a £80,000 difference in price. Man City may have the new found riches, however this doesn’t translate to property as United have also enjoyed a larger increase over the last year, up 4 per cent to City’s 3 per cent.
Liverpool and Everton are the two at the bottom of the Premiership property table, neither team has managed more than a 1 per cent increase on last year. (Full details in eMoov’s Premier League homes infographic)
Russell Quirk, founder and chief executive of eMoov.co.uk, commented:
“Although the top two make for familiar reading, it’s interesting that a successful, wealthy Premier League club, doesn’t necessarily translate to a thriving property market in the surrounding areas. I think in terms of property, West Ham and Tottenham are the ones to watch. The developments in terms of location and transport infrastructure should see prices in both areas boosted as a result. “
Premier League homes infographic
| Rank | Team | Stadium | Postcode | Average House Price 2015/16 Season | % Change |
| 1 | Chelsea | Stamford Bridge | SW6 | £1,137,550 | -5% |
| 2 | Arsenal | Emirates | N7 | £575,676 | 6% |
| 3 | Spurs | White Hart Lane | N17 | £312,410 | 6% |
| 4 | West Ham | Upton Park | E13 | £306,451 | 7% |
| 5 | Watford | Vicarge Road | WD18 | £300,411 | 5% |
| 6 | Crystal Palace | Selhurst Park | SE25 | £295,165 | 4% |
| 7 | Bournemouth | Dean Court | BH7 | £270,511 | 3% |
| 8 | Southampton | St Mary’s Stadium | SO14 | £207,618 | 5% |
| 9 | Leicester | King Power Stadium | LE2 | £202,483 | 4% |
| 10 | Man Utd | Old Trafford | M16 | £194,297 | 4% |
| 11 | Norwich | Carrow Road | NR1 | £191,151 | 1% |
| 12 | Newcastle | St James Park | NE1 | £156,470 | 2% |
| 13 | West Brom | The Hawthorns | B71 | £131,398 | 2% |
| 14 | Stoke | Britannia Stadium | ST4 | £117,260 | 1% |
| 15 | Swansea | Liberty Stadium | SA1 | £115,584 | 0% |
| 16 | Man City | Etihad Stadium | M11 | £110,666 | 3% |
| 17 | Aston Villa | Villa Park | B6 | £101,674 | 4% |
| 18 | Sunderland | Stadium of Light | SR5 | £96,769 | 4% |
| 19 | Everton | Goodison Park | L4 | £72,873 | 1% |
| 20 | Liverpool | Anfield | L4 | £72,873 | 1% |


